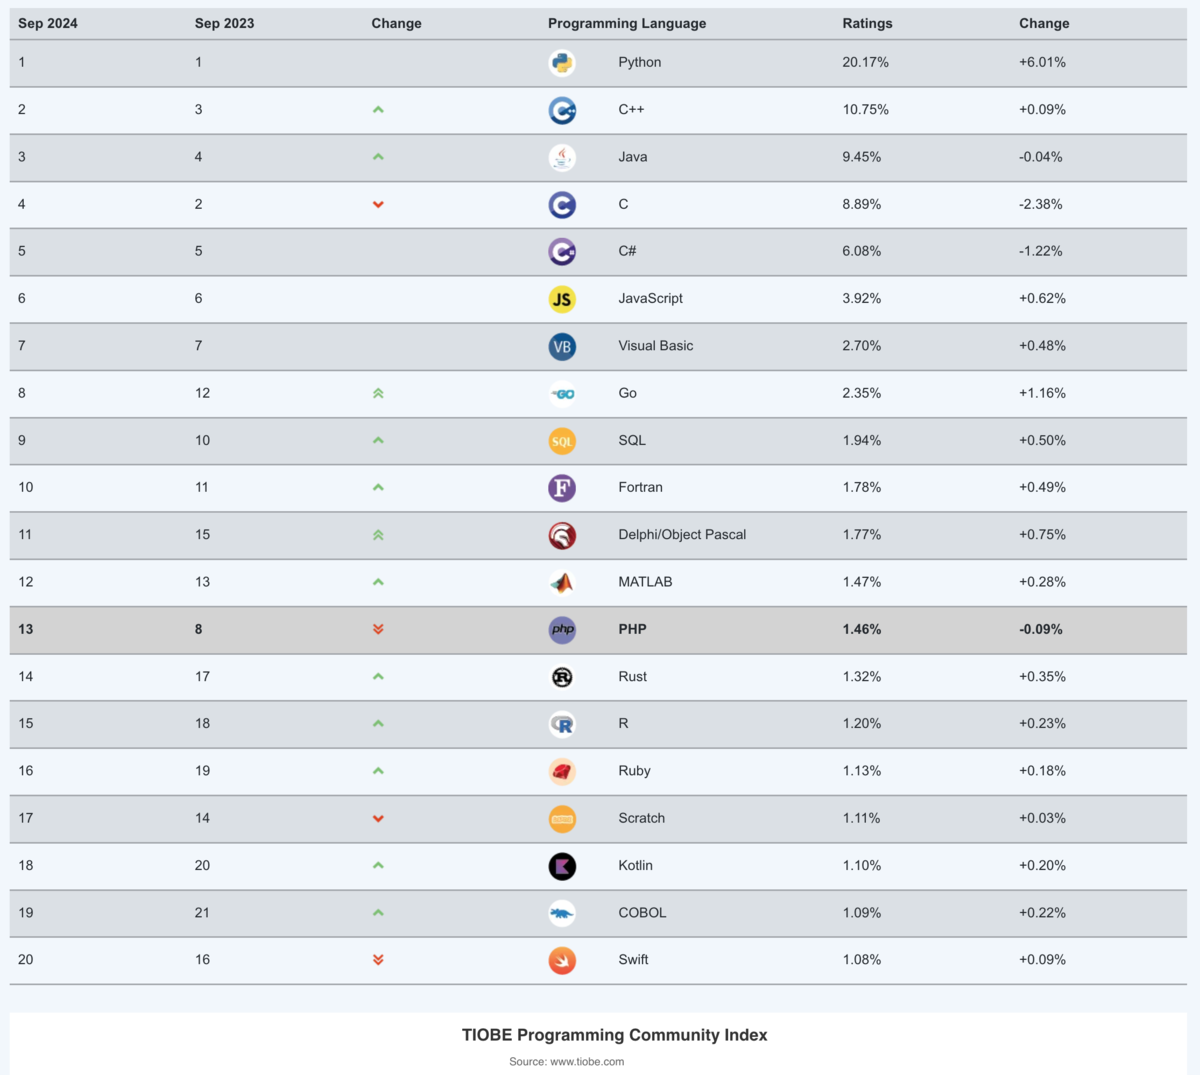
Fortran 10位 変わらず
C 言語凋落傾向。


chatGPT 謹製 python
import numpy as np
import matplotlib.pyplot as plt

# Rank and ratings data for top 50 programming languages
rank = np.arange(1, 51)
ratings = np.array([
    20.17, 10.75, 9.45, 8.89, 6.08, 3.92, 2.70, 2.35, 1.94, 1.78,
    1.77, 1.47, 1.46, 1.32, 1.20, 1.13, 1.11, 1.10, 1.09, 1.08,
    0.99, 0.92, 0.79, 0.76, 0.72, 0.71, 0.71, 0.64, 0.63, 0.61,
    0.51, 0.49, 0.46, 0.46, 0.45, 0.37, 0.36, 0.34, 0.32, 0.26,
    0.25, 0.22, 0.20, 0.20, 0.17, 0.17, 0.17, 0.16, 0.15, 0.15
])

# Updated language names for each rank from TIOBE index
languages = [
    'Python', 'C++', 'Java', 'C', 'C#', 'JavaScript', 'Visual Basic', 'Go', 'SQL', 'Fortran',
    'Delphi/Object Pascal', 'MATLAB', 'PHP', 'Rust', 'R', 'Ruby', 'Scratch', 'Kotlin', 'COBOL', 'Swift',
    'Assembly language', 'Classic Visual Basic', 'SAS', 'Prolog', 'Lisp', 'Ada', 'Perl', 'Haskell', '(Visual) FoxPro', 'Dart',
    'Julia', 'Objective-C', 'Lua', 'Transact-SQL', 'Scala', 'D', 'VBScript', 'ABAP', 'PL/SQL', 'Solidity',
    'TypeScript', 'GAMS', 'PowerShell', 'Awk', 'Elixir', 'F#', 'RPG', 'ML', 'Logo', 'Ladder Logic'
]

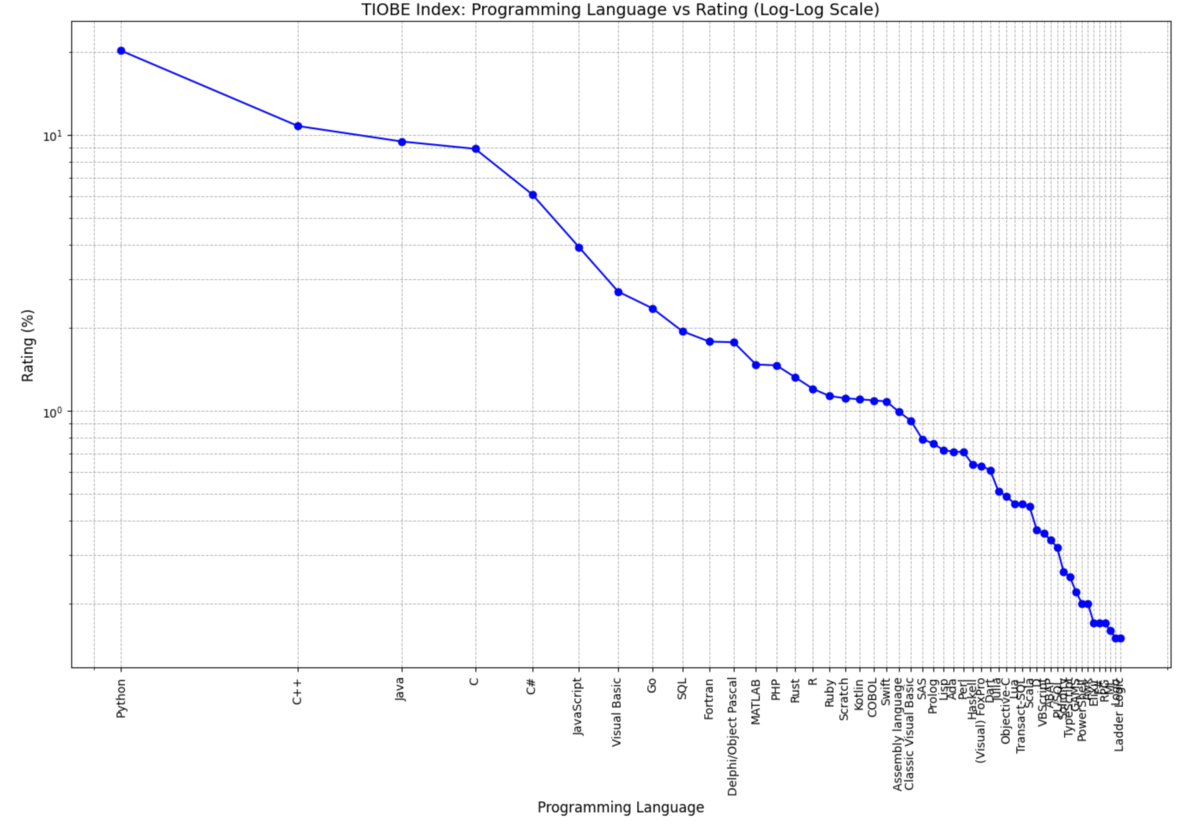
# Create a log-log plot
plt.figure(figsize=(14, 8))  # Adjust the figure size for better clarity
plt.loglog(rank, ratings, marker='o', linestyle='-', color='b')

# Set the x-axis to show programming language names
plt.xticks(rank, languages, rotation=90)  # Rotate language names for better readability

# Set plot title and labels
plt.title('TIOBE Index: Programming Language vs Rating (Log-Log Scale)', fontsize=14)
plt.xlabel('Programming Language', fontsize=12)
plt.ylabel('Rating (%)', fontsize=12)

# Enable grid for better visualization
plt.grid(True, which="both", ls="--", linewidth=0.7)

# Adjust layout to prevent overlap
plt.tight_layout()

# Display the plot
plt.show()


