Fortran の配列を渡して plot
昨日の続きで、Fortran 側の変数や配列を Python に渡して matplotlib で図を書かせてみます。
すでに下記 blog の中にほぼ答えが書かれているので、わずかな変更で実現できました。
以下のスレが参考に挙げられています。
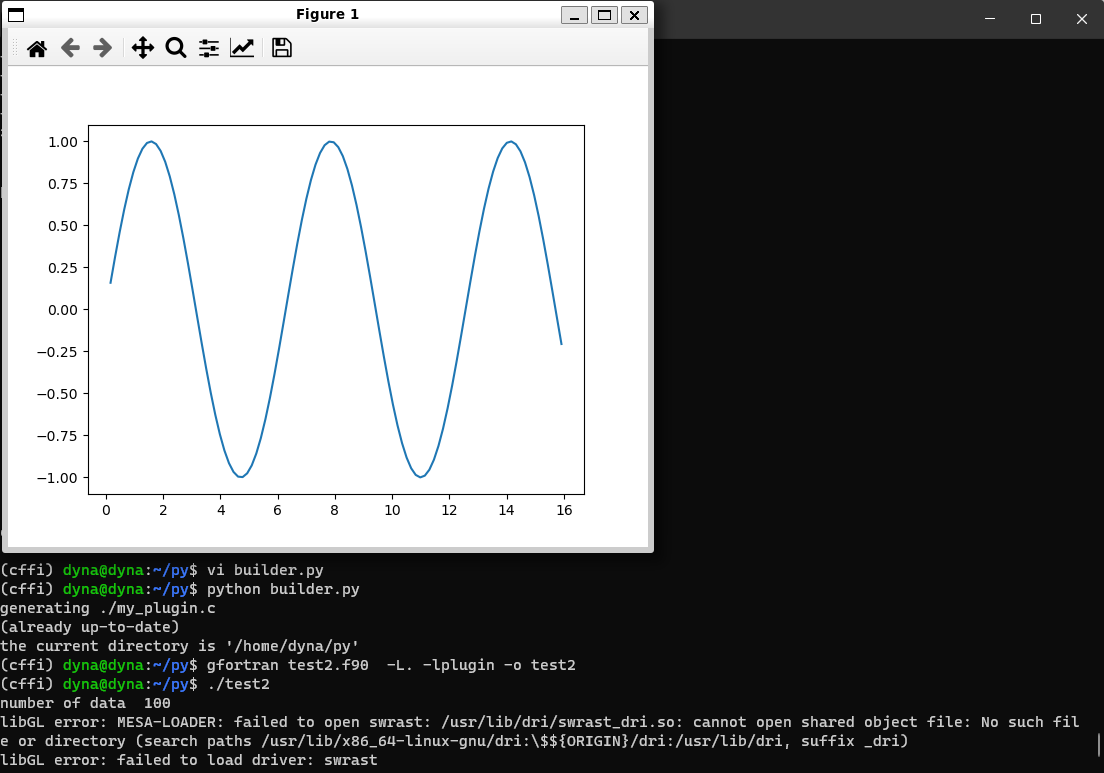
実行結果
Fortran 側で sin カーブの x, y データを用意して、それを python 側に渡して matplotlib で図示しています。要素 100 個の配列ふたつと、配列サイズのスカラー変数ひとつを渡しています。
Fortran からの Python 利用はこれがお手軽でいい気がします。単純 plot でよければ、shared library だけあればいいので、LD path の通ったところに置いておけば、Fortran からのお手軽プロットは python に煩わされずに行けようかと思われます。拡張も容易であるし。
(cffi) dyna@dyna:~/py$ python builder.py
generating ./my_plugin.c
(already up-to-date)
the current directory is '/home/dyna/py'
(cffi) dyna@dyna:~/py$ gfortran test2.f90  -L. -lplugin -o test2
(cffi) dyna@dyna:~/py$ ./test2
number of data  100
libGL error: MESA-LOADER: failed to open swrast: /usr/lib/dri/swrast_dri.so: cannot open shared object file: No such file or directory (search paths /usr/lib/x86_64-linux-gnu/dri:\$${ORIGIN}/dri:/usr/lib/dri, suffix _dri)
libGL error: failed to load driver: swrast
ソース・プログラム
test2.f90 c interface でスカラー変数を渡すときは、value 属性を与えて call by value にします。
program call_python
  use, intrinsic :: iso_c_binding
  implicit none
  interface
      subroutine plot(x_c, y_c, n) bind (c, name = 'plot')
          use iso_c_binding
          implicit none
          real(c_double) :: x_c(n), y_c(n)
          integer(c_int), value :: n
      end subroutine plot
  end interface
  real(c_double) :: x(100), y(100)
  integer :: i

  x = [(real(0.125d0 * i / atan(1.0d0)), i = 1, size(x))]
  y = sin(x)
  call plot(x, y, size(x))

end program call_python
my_module.py blog 記事そのままですが、import numpy as np を加えました。
# my_module.py
import numpy as np
# Create the dictionary mapping ctypes to np dtypes.
ctype2dtype = {}

# Integer types
for prefix in ('int', 'uint'):
    for log_bytes in range(4):
        ctype = '%s%d_t' % (prefix, 8 * (2**log_bytes))
        dtype = '%s%d' % (prefix[0], 2**log_bytes)
        # print( ctype )
        # print( dtype )
        ctype2dtype[ctype] = np.dtype(dtype)

# Floating point types
ctype2dtype['float'] = np.dtype('f4')
ctype2dtype['double'] = np.dtype('f8')


def asarray(ffi, ptr, shape, **kwargs):
    length = np.prod(shape)
    # Get the canonical C type of the elements of ptr as a string.
    T = ffi.getctype(ffi.typeof(ptr).item)
    # print( T )
    # print( ffi.sizeof( T ) )

    if T not in ctype2dtype:
        raise RuntimeError("Cannot create an array for element type: %s" % T)

    a = np.frombuffer(ffi.buffer(ptr, length * ffi.sizeof(T)), ctype2dtype[T])\
          .reshape(shape, **kwargs)
    return a
builder.py
import cffi
ffibuilder = cffi.FFI()

header = """
extern void plot(double *, double *, int n);
"""

module = """
from my_plugin import ffi
import numpy as np
import matplotlib.pyplot as plt
import my_module

@ffi.def_extern()
def plot(x_ptr, y_ptr, n):
    print("number of data ", n)
    x = my_module.asarray(ffi, x_ptr, shape=(n,))
    y = my_module.asarray(ffi, y_ptr, shape=(n,))
    plt.plot(x, y)
    plt.show()
"""

with open("plugin.h", "w") as f:
    f.write(header)

ffibuilder.embedding_api(header)
ffibuilder.set_source("my_plugin", r'''
    #include "plugin.h"
''')

ffibuilder.embedding_init_code(module)
ffibuilder.compile(target="libplugin.so", verbose=True)
")
")